

The Augustus Journal
Worker Tax. Investor Tax. The Pivot Pre-IPO Shareholders Need to See.

5 Takeaways
- The U.S. tax code contains two separate economies. Ordinary income from wages, RSU vesting, and NSO spread is taxed at one set of rates. Long-term capital gains and qualified dividends are taxed at another. For a high earner in California, the structural gap between the two sides, depending on your specific situation, can run 15 to 25 percentage points per dollar.
- Convert those percentages into your calendar. A 50% tax rate, in most cases, represents roughly six months of your working year going to the tax code. A 33% rate is closer to four months. Over a 20 year career, the gap adds up to more than three full years of your calendar.
- The Worker to Investor framework is a three-level structural map. Level 1 is earned income. The pivot is savings. Level 2 is assets. Level 3 is passive income generated at the lower-taxed Investor rates.
- The multi-million dollar figure in your pre-IPO equity portal is still classified as Worker-side income until it is deployed into Investor-side assets. The IPO creates the opportunity to cross the pivot. The deployment decision is what actually does it.
- Tender offer timing, AMT crossover strategy, concentration risk, and post-IPO sell schedules are not four separate decisions. They are four views of the same structural question: how efficiently are you moving equity across the pivot?
Watch the Full Breakdown
We filmed a complete walkthrough of the framework. The two economies inside the tax code. The months reframe that makes the structural gap visceral. The juice-versus-squeeze test for every pivot decision. And the full three-level map that underpins every piece of planning we do at Augustus Wealth.

The framework applies to any pre-IPO shareholder. Employees at SpaceX, Anthropic, Anduril, Databricks, Stripe, and any late-stage private company approaching a liquidity event are all navigating the same underlying question: will the equity in your portal ever cross from Worker-side income into Investor-side wealth?
The Two Economies Inside the Tax Code
There are two tax systems operating inside the United States code at the same time. Same country. Same IRS. Same Form 1040. Two completely different sets of rules.
The Worker Economy
The Worker economy taxes ordinary income. Your salary. Your bonus. Your RSU vesting at fair market value. Your NSO exercise spread. Any ordinary income recognized through an ISO disqualifying disposition. At the top federal bracket, ordinary income is taxed at 37%. Add California state tax, which tops out at 13.3%. Add Medicare. Add the Net Investment Income Tax when it applies. For a high earner in California, the combined top marginal rate on ordinary income, in most cases, can exceed 50 cents on the dollar.
That is a fact about the structure of the tax code. Your specific situation will vary based on your deductions, filing status, and state of residence.
The Investor Economy
The Investor economy taxes long-term capital gains and qualified dividends. The top federal rate is 20%. Add the 3.8% Net Investment Income Tax. Add state tax, which in California applies ordinary rates to capital gains for most high earners. The combined top rate on this side, depending on your specific situation, lands roughly in the low-to-mid 30s.
Sit with those two numbers for a moment. On the Worker side, the code, in most cases, can take more than half. On the Investor side, on the same dollar, the code, in most cases, takes about a third.
The Gap Converted Into Your Calendar
Percentages are abstract. Time is not.
A 50% tax rate, in most cases, is roughly six months of your working year. Six months of your commute. Six months of your meetings. Six months of your calendar going to the tax code before any of it reaches your bank account.
A 33% tax rate is closer to four months.
The structural gap between the two sides, depending on your specific situation, can mean roughly two extra months of every working year that, on one side of the pivot, build your wealth, and on the other side, do not. Over a 20 year career, that gap represents, roughly, 40 months of your calendar. More than three full years.
The pivot from Worker to Investor is what decides whether those three years work for you or work for the tax code.
The tax code is not punishing workers. The code is a set of incentives. It rewards holding assets for 12 months or more, generating income from ownership rather than labor, and deferring gains until they qualify for long-term treatment. When you behave like an investor, the code treats you like one.
Why Pre-IPO Shareholders Get Stuck
Three reasons. All three apply directly to employees holding equity at SpaceX, Anthropic, Anduril, Databricks, and Stripe.
Reason 1: Income Feels Like Progress
A bigger paycheck, a bigger bonus, a bigger RSU vest. All of it feels like forward motion. And for a while, it is. But if every additional dollar of income flows through the Worker side of the code, then every raise is, in most cases, taxed at your highest marginal rate. You are effectively getting a smaller share of each subsequent dollar.
Many high earners double their income over five years and do not double their asset base. Not because they are spending recklessly. Because the second $100,000 of income is, in most cases, taxed more aggressively than the first, and because lifestyle spending tends to rise in lock step with after-tax pay.
Reason 2: Paper Wealth Looks Like Real Wealth
The multi-million dollar number in your equity portal feels like you have already crossed the pivot. You have not. That number is still 100% on the Worker side of the code. Unrealized. Undeployed. Locked inside a single concentrated position.
The IPO does not automatically move that number across the pivot. The IPO creates the opportunity to move it. The deployment decision is what actually does it.
We have sat across the table from shareholders who walked into a tender offer with a seven-figure equity position and walked out of the IPO year with, in most cases, less permanent wealth than they expected. Not because the stock underperformed. Because the proceeds flowed right back into Level 1 spending instead of being deployed across the pivot. The wealth was generated. It just was not captured.
The Juice-Versus-Squeeze Test
The short-term cost of moving across the pivot looks expensive. Exercise ISOs now and you owe AMT in April. Sell at the tender and you owe capital gains. Build out a diversified portfolio and you are making deliberate decisions instead of letting your equity ride.
So ask a simple question. Is the juice worth the squeeze?
The squeeze is the short-term tax cost. The hassle of staging exercises across multiple tax years. The paperwork. The discipline to redirect proceeds into Level 2 instead of letting them fund a bigger lifestyle.
The juice, depending on your specific situation, is potentially decades of Investor-side compounding on the lower-taxed side of the code. The roughly two extra months of every working year. For the rest of your financial life.
Most shareholders, once they see both sides of that trade clearly laid out, conclude the juice is worth the squeeze. That is a decision you should make with real numbers and your complete financial situation in front of you, not based on which side feels easier in the moment.
→ Model your AMT exposure and exercise cost at the current 409A
Reason 3: The Window Closes Before You Notice
Pre-IPO shareholders operate on a timeline they often do not control. Blackout periods restrict when you can exercise. Tender offers open and close on the company’s schedule. An IPO is followed by a lockup, typically 90 to 180 days, during which you still cannot sell. For many shareholders, that adds up to 8 to 12 months where the pivot you could have made, you can no longer make.
If your plan is “I will deploy after the IPO,” you need to look at the calendar and ask yourself whether “after the IPO” has a real date on it for your specific situation. For most shareholders right now, the earliest realistic public liquidity is, roughly, a year or more out. That is a long time to stand on one side of the pivot, paying Worker-side taxes on every vest, without being able to move anything.
The Framework: Three Levels, One Pivot
 At Augustus Wealth, we call the structural map the Worker to Investor framework. Three levels. One pivot.
Level 1: Earned Income
Level 1 is where most professionals spend their entire careers. Earned income flows in. Worker-side taxes come out. What remains funds your life.
For a pre-IPO shareholder, Level 1 includes your base salary, your RSU vests, your NSO exercise spread, and, in most cases, any ordinary income recognized through an ISO disqualifying disposition. All of it is Worker-side.
Nothing is wrong with Level 1. This is how you survive and, in many cases, how you thrive. But by itself, Level 1 never builds permanent wealth. Because every dollar that comes in gets taxed on the high side of the code and then spent.
The Pivot: Savings
The pivot is savings. That is the entire mechanism. The dollars you do not spend are the only dollars that can cross over to the Investor side of the code. Savings is the only input Level 2 accepts.
Savings is not glamorous. It is not the stock going up. It is not the tender offer check hitting your account. It is the boring, unsexy decision to take a portion of each dollar that hits your bank account and send it across the pivot instead of into your lifestyle.
For most clients, this is the hardest part of the framework. Not because they cannot do it. Because it does not feel like progress. And we are wired to chase progress.
Level 2: Assets
Level 2 is where savings becomes assets. Diversified portfolios. Index funds. Direct-indexed accounts for tax efficiency. Fixed income. Real estate, in some cases. Retirement accounts being maxed, including 401(k), backdoor Roth, and Mega Backdoor Roth where your plan allows. HSA contributions invested rather than spent.
This is the middle of the map. The construction phase. You are building the machine that will, eventually, produce the Investor-side income.
Level 2 for a pre-IPO shareholder looks like this: proceeds from a tender offer, carefully staged for tax efficiency, deployed into a diversified portfolio. Post-IPO sales, structured to qualify for long-term capital gains treatment where possible, funneled into the same machine. Retirement accounts filled to their legal maximum every year. Emergency reserves held in high-yield cash to carry you through the low-liquidity zone without forced selling.
→ Model your post-IPO portfolio and critical mass target
Level 3: Passive Income, Investor Tax, Leverage
Level 3 is where assets produce income of their own. Qualified dividends. Long-term capital gains from disciplined rebalancing. Interest from fixed income, which is still Worker-side taxed but embedded in a portfolio where the overall tax profile is dominated by the Investor side. In some cases, real estate cash flow. In some cases, business income from an ownership position outside your concentrated company stock.
At Level 3, your portfolio is working for you on the lower-taxed side of the code. And because the assets themselves are productive, you have what the framework calls leverage. Not debt leverage. Optionality leverage. The ability to stop working, change jobs, take a sabbatical, start a company, or make a decision that is not dictated by next quarter’s vest.
Every Pre-IPO Decision Lives on This Map
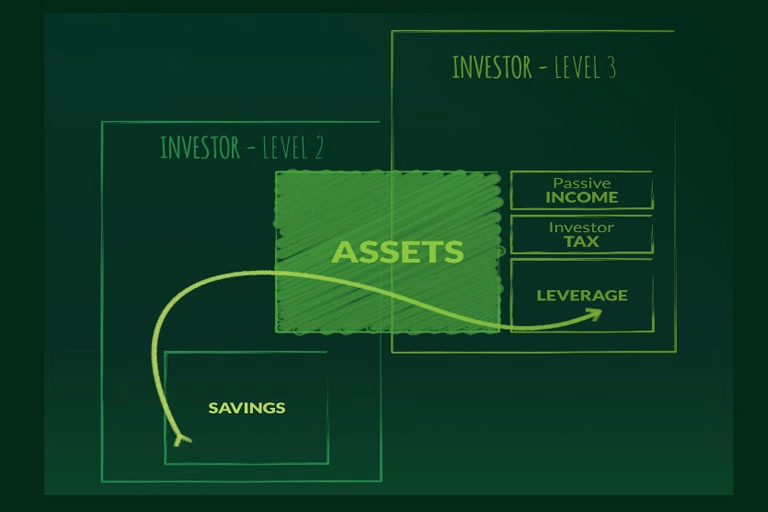 Once you can see the framework, every equity planning question maps to a specific place on it.
Tender Offer Timing
Tender offer timing is whether or not you fund Level 2 while the door is still open. Tender offers are one of the few pre-IPO moments where equity can cross the pivot in a tax-advantaged way. Missing the window leaves your proceeds stuck on the Worker side.
→ Simulate a tender offer decision
AMT Crossover Strategy
AMT crossover strategy is minimizing the tax cost of getting your ISOs across the pivot efficiently. Multi-year exercise staging, executed against your AMT-free zone, is the mechanism that lets you move ISO shares into long-term capital gains territory without triggering disproportionate tax drag.
Concentration Risk
Concentration risk is how much of your net worth is still trapped in Level 1. Concentration is not a theoretical risk score. It is the dollar amount you stand to lose if your single-stock position declines by 20%, 30%, or 50% from its current valuation.
→ Score your concentration risk
Post-IPO Sell Schedules
Post-IPO sell schedules are the mechanism that moves equity across the pivot on a deliberate cadence instead of an emotional one. The shareholders who build the most durable post-IPO wealth are not reacting to lockup expiry dates. They are executing a sell schedule designed years in advance.
RSU Withholding Gaps
RSU withholding gaps are a Level 1 tax efficiency question. Standard 22% supplemental withholding falls, in most cases, 15 to 25 points short of actual liability for California high earners. Closing that gap on your own schedule, with cash on hand, preserves optionality at Level 2.
→ Calculate your RSU withholding gap
It is all the same map.
What This Framework Means for You This Year
If you are holding pre-IPO equity at SpaceX, Anthropic, Anduril, Databricks, Stripe, or any late-stage private company, four questions determine where you sit on the framework today.
1. What Portion of Your Net Worth Is Still in Level 1?
Sum the after-tax value of your vested equity, your unvested equity, and your non-retirement liquid assets. The percentage in Level 1, meaning your company stock plus future vesting income, tells you how concentrated you are.
2. How Much of Your Annual After-Tax Income Is Crossing the Pivot?
If 100% of your after-tax income is funding Level 1 lifestyle, none of it is funding Level 2. If 15% is crossing the pivot, you are building the machine. If 30% is crossing, you are accelerating.
3. What Is Your Level 3 Number?
The portfolio value at which your diversified assets produce enough Investor-side income to sustain your lifestyle without any single company appreciating another dollar. Critical mass is the point where work becomes optional.
→ Find your critical mass number
4. What Is Your Current Transition Plan?
If you do not have one, every tender, every vest, and every IPO decision defaults to whatever feels easiest in the moment. That is the most expensive way to navigate a liquidity event.
Frequently Asked Questions
What is the Worker to Investor framework?
The Worker to Investor framework is a three-level structural map for converting earned income into permanent, diversified wealth. Level 1 is earned income (salary, RSU vesting, NSO spread, ISO disqualifying dispositions). The pivot is savings, the only input that moves dollars across to the Investor side of the tax code. Level 2 is assets (diversified portfolios, retirement accounts, fixed income). Level 3 is passive income generated from those assets at the lower-taxed Investor rates.
Why is this framework especially relevant for pre-IPO shareholders?
Pre-IPO shareholders at companies like SpaceX, Anthropic, Anduril, Databricks, and Stripe often hold multi-million dollar equity positions that are still classified as Worker-side income until they are exercised, sold, held long enough to qualify for long-term treatment, and deployed into Investor-side assets. The IPO creates the opportunity to cross the pivot. The deployment decision is what actually does it.
How big is the tax gap between Worker and Investor income?
For a high earner in California, the combined top marginal rate on ordinary income, in most cases, can exceed 50% when federal, state, Medicare, and the Net Investment Income Tax are stacked. The combined top rate on long-term capital gains and qualified dividends, in most cases, lands roughly in the low-to-mid 30s. The structural gap, depending on your specific situation, can run 15 to 25 percentage points per dollar.
What does the “months” reframe mean?
Converting tax rates into calendar time makes the structural gap easier to see. A 50% tax rate, in most cases, represents roughly six months of your working year. A 33% tax rate is closer to four months. Over a 20 year career, the roughly two-month-per-year gap between Worker and Investor taxation adds up to more than three full years of your calendar.
Is the pivot the same as “investing”?
No. The pivot is savings. Investing is what happens inside Level 2, once the savings have crossed the pivot. The distinction matters because most high earners conflate the two. If after-tax dollars never leave Level 1 to begin with, there is nothing for Level 2 to invest.
→ Run your numbers across all five calculators
How does tender offer timing fit into the framework?
A tender offer is one of the few pre-IPO moments when equity can cross the pivot in a tax-advantaged way. Proceeds can be deployed directly into Level 2 assets. Missing a tender window leaves those potential proceeds stuck in Level 1, either as unrealized paper wealth or as future ordinary-income vesting.
How does AMT crossover strategy fit into the framework?
AMT crossover strategy is the mechanism for moving ISO shares across the pivot as tax-efficiently as possible. A multi-year exercise plan, sized against your AMT-free zone each year, shifts equity from Level 1 ordinary-income treatment into potential long-term capital gains territory without triggering disproportionate tax drag.
How does concentration risk fit into the framework?
Concentration risk is a direct measurement of how much of your net worth is still trapped in Level 1. A shareholder with 80% of net worth in a single company stock is heavily Worker-side, regardless of the paper valuation. Moving that position down to 20% to 40% through deliberate sales and Level 2 deployment is how the framework gets applied in practice.
What is the Level 3 “critical mass” number?
Critical mass is the portfolio value at which your diversified Level 2 assets produce enough Investor-side income to cover your annual lifestyle expenses without requiring any single position to appreciate further. Once you reach critical mass, work becomes optional and concentration risk becomes an active choice rather than a structural necessity.
How do I apply the framework to my own pre-IPO equity?
Start by running the three most relevant calculators at your current numbers. The Concentration Risk Analyzer shows how much of your net worth is in Level 1. The Critical Mass Simulator shows your Level 3 target. The ISO Exercise Calculator or RSU Tax Calculator shows the cost of moving equity across the pivot. Once you have those three inputs, you have the foundation for a coordinated annual plan.
The Framework Is the Map. The Tools Are the Instruments.
Pre-IPO equity rarely becomes permanent wealth by accident. It becomes permanent wealth when shareholders treat every tender, every vest, and every post-IPO sell decision as one coordinated sequence of moves across the pivot.
If your equity represents a meaningful portion of your net worth, a 30-minute conversation with our team can map where you currently sit on the framework: Level 1 concentration, pivot rate, Level 2 construction, and Level 3 critical mass targets.
The tools below are free and require no login. Use them to run your numbers today.
→ ISO Exercise and AMT Calculator
→ RSU Tax and Withholding Gap Calculator
→ Tender Offer Decision Simulator
→ Equity Tools Hub (all calculators)
Or skip straight to a conversation: Talk to Derek →
Watch the full breakdown: Worker Tax. Investor Tax. The Pivot Pre-IPO Shareholders Need to See. (YouTube)
DISCLOSURE:
Augustus Wealth, LLC is a registered investment adviser. Advisory services are only offered to clients or prospective clients where Augustus Wealth, LLC and its representatives are properly licensed or exempt from licensure. This financial planning assessment is solely for informational purposes. Past performance is no guarantee of future returns. Investing involves risk and possible loss of principal capital. This assessment is built based off information provided by the client and cannot be relied upon as financial advice. No advice may be rendered by Augustus Wealth, LLC unless a client service agreement is in place.
Stay in the loop
